An alert is a request for human action. If nobody can explain what action it requires, it belongs on a dashboard or in a trend report, not in the paging channel.
Alert on user impact first
Start with availability, latency, error rate, saturation, and queue age. Resource utilization is useful context, but a CPU graph alone rarely tells an operator whether customers are affected.
The problem: an alert nobody trusted
The paging channel had become a second monitoring dashboard. CPU alerts fired during normal batch work, memory alerts fired during expected cache warming, and nobody could tell which notifications required action. The team had learned to mute the system, which meant the next real incident would arrive quietly.
We reviewed a week of notifications and classified every alert as page, ticket, dashboard, or delete. The uncomfortable result was that several high-severity alerts had no owner or runbook. Their severity was fiction, so we removed the fiction.
- alert: ApiHighErrorRate
  expr: |
    (
      sum by (service) (rate(http_requests_total{status=~"5.."}[5m]))
      /
      clamp_min(sum by (service) (rate(http_requests_total[5m])), 1e-9)
    ) > 0.05
    and on (service)
    sum by (service) (rate(http_requests_total[5m])) > 1
  for: 10m
  labels:
    severity: page
  annotations:
    summary: API error rate is above 5 percent
    runbook_url: https://example.com/runbooks/api-errors
Make the alert self-contained
Include the affected service, environment, symptom, dashboard, owner, and runbook. The first five minutes of an incident should not be spent asking which team owns the alert.
Review alert quality
Track false positives, notification volume, time to acknowledge, and time to resolve. Delete or tune alerts that repeatedly produce no action. Alert fatigue is an availability risk for the people operating the system.
The resolution
We replaced resource-only pages with symptom alerts, added service ownership and runbook links, and reviewed the notification report after each incident. The number of pages fell, but the more important change was that the remaining pages led to a first action within minutes.
Spend paging attention deliberately
Use labels that preserve the service and ownership boundary, suppress low-volume ratios that are statistically noisy, and test the expression against both incident and normal traffic. For critical services, use SLO burn-rate alerts over multiple windows so a short spike and a sustained budget burn do not page identically. Review the query, route, runbook, and owner together after an incident; an alert is a small product interface for the person receiving it.
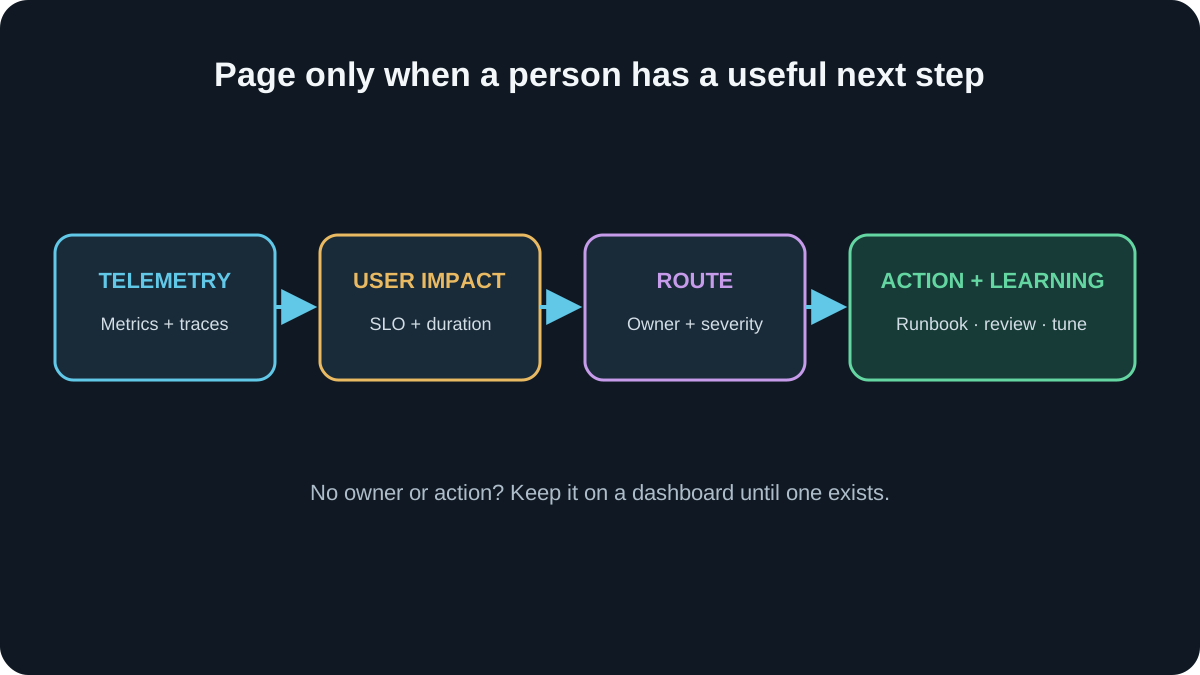
A page is a request to interrupt a human. That makes it one of the most expensive outputs in the monitoring system.
Treat attention as a reliability budget
A good alert narrows the first decision. It does not attempt to describe the entire system.